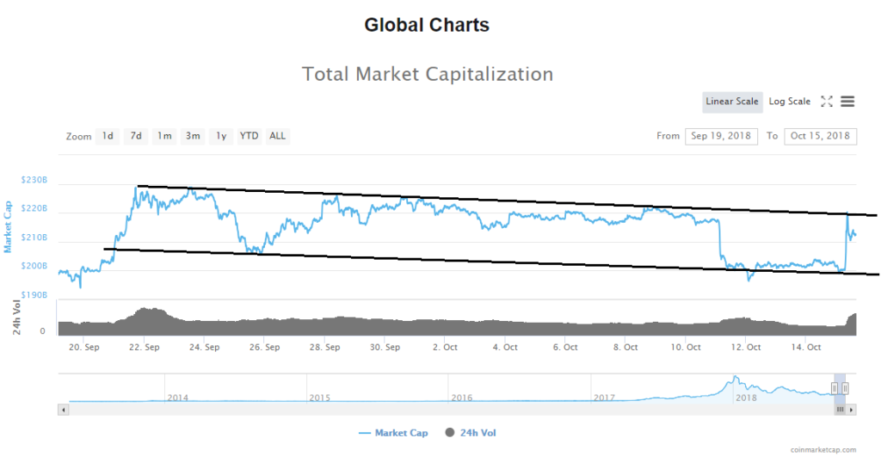
From yesterday’s low which was slightly below $200B the evaluation of the cryptocurrency market capitalization has spiked up to $220,252,569,861 but has pulled back quickly to around $212B level.
- Market Cap: $212,478,735,722
- 24h Vol: $20,812,434,086
- BTC Dominance: 54.3%
As you can see from the global chart the evaluation spiked up to the descending channels resistance line in which the evaluation is from 22. of September. Consequently, the market is in green today with an average percentage of change being around 5.6%. Biggest gainers among top 100 coins are Komodo with an increase of 16.4%, Kyber Network with a 15.2% and Aurora with 25%.

Bitcoin’s market dominance evaluation is still in an upward trajectory which is odd as this evaluation is negative in correlation with the evaluation of the global chart.

News
The reason behind this unexpected and sudden quick market recovery is the Tether ‘crash’, as reported by Newsbtc.
More specifically, Bitcoin somehow eclipsed $7,200 on Bitfinex, Kraken, Binance, and OKEx, which are all platforms that support USDT, while Bitcoin only moved a tad above $6,700 on non-Tether-enabled platforms.

Tether fell 6% below its normal rate today, further adding to the suspicion.

Looking at the chart above and inverting it and putting it to comparison with the global chart you can see the similarities.

Bitcoin Price Analysis BTC/USD
From today’s low at $6300 the price of Bitcoin has spiked up to $7788 which is 23.8% increase, but has fallen from those levels quickly as it came and is now trading at $6861.

As you can see from the hourly chart above the price went beyond the horizontal resistance level at $6876 but is now right back on it searching for support. Needless to say the price also went beyond both descending and symmetrical resistance lines which served as strong support in the past. I believe that this upward move isn’t real demand pushing the price of Bitcoin, but a scared crowed mentality wanting do liquidate their crypto positions while Bitcoin is above 6000$. Thus I believe that this upward move will serve a a good exit point for those who bought around $6000 and were waiting all year long for something to happen, but lost confidence along the way.
This upward move might also activate a lot of buying activity that would outrun the selling one which would push the price of Bitcoin higher than the current levels, but ultimately this would still be views as a recovery before more down movement until the price surpass the prior swing high at $9956.
Looking at the 4 hour chart we can see the significant horizontal level the price has spiked up to.

As you can see the horizontal level is the prior range support which now serves as resistance and the price spiked up to it but was rejected quickly which indicated that sellers are there and are still willing to slam that price back.
Looking at the daily chart we can see that the price has still not made clear on whether or not we are seeing the start of breakout from the triangles and the start of an uptrend or will this result in a fake-out.

No decisions or conclusions should be made until we see how today’s candle will close and where tomorrows would open. If today’s candle closes below the triangle’s resistance than the fake-out scenario is in play, but if today’s candle closes above it and tomorrows candle manages to stay above it than we might see the price of Bitcoin potentially increasing to $9932 level. That increase would only be a recovery wave before the price falls further down which was my alternative Elliott Wave scenario from back in June.
Market sentiment
Technical indicators are signaling a buy from 1-hour to monthly time frame while 15 min chart is neutral and lower time frames are bearish.

Pivot points
S3 5406.2
S2 5915.9
S1 6121.2
P 6425.6
R1 6630.9
R2 6935.3
R3 7445.0
Conclusion
On the below graph you can see the mentioned alternative scenario for the price of Bitcoin. In this scenario the price of Bitcoin has undergone a three stage correction – first being the steep downfall, second is a consolidation structure and the last one is a trend continuation.
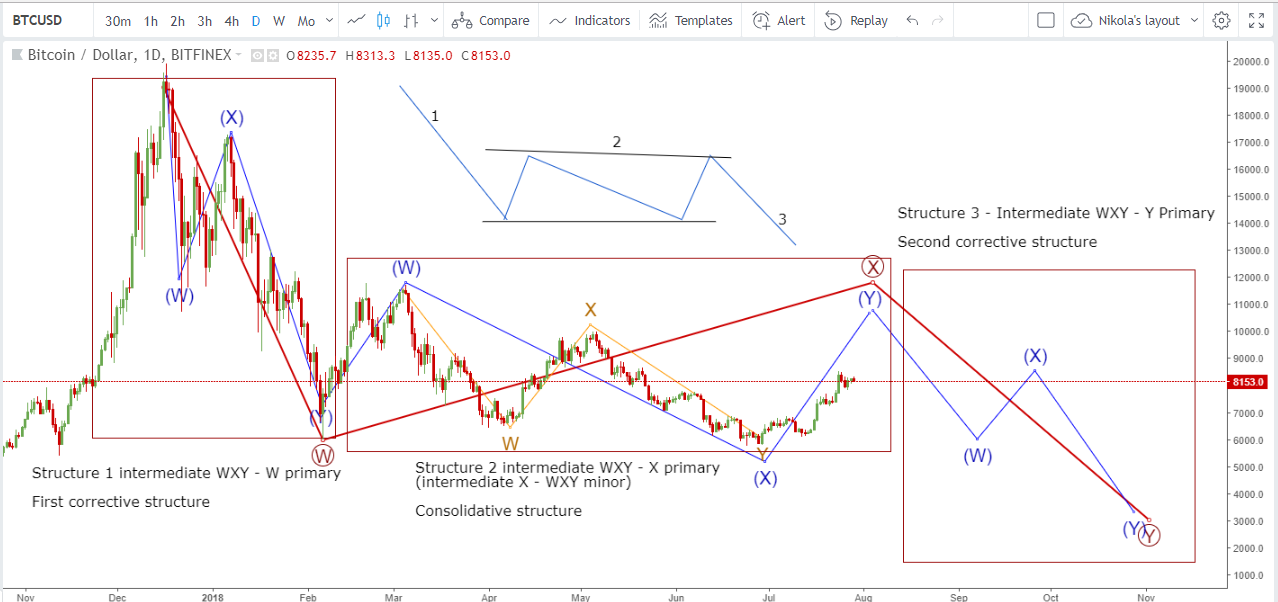
On today’s chart this scenario would look like on the chart below. This final stage of recovery is considered to be slightly lower than the last swing high which is why I said that I would consider that the price of Bitcoin has started an uptrend until it passes beyond $10k level.

This is still my alternative scenario and is actually more bearish, because the final stage would push the price of Bitcoin significantly down to around $3000. My primary projection is a lower low around $5200 in a straight downfall manner and I still believe that this increase wouldn’t do much for the market sentiment in general and would end up with a lower low much like it did two prior times on a recovery much greater than the current one.
Related
All content on Blockonomi.com is provided solely for informational purposes, and is not an offer to buy or sell or a solicitation of an offer to buy or sell any security, product, service or investment. The opinions expressed in this Site do not constitute investment advice and independent financial advice should be sought where appropriate.
Source: Crypto Market Update: Are the Bulls Back? (Bitcoin BTC Price Analysis)